root@kaus.com:~/projects$ cat mmg.md
OSRS Market Tools (MMG)
activePersonal
Kbit · page guide
1 / 4
Use the section map on long studies.
Jump between methodology, results, experiments, limitations, and related writing without losing your place.
2 / 4
The narrative carries the claim.
Read each section as problem, method, evidence, and boundary. Negative results remain part of the story.
3 / 4
Inspect figures alongside the narrative.
Read figures in place, scroll wide charts or tables horizontally, and follow any source links for the underlying evidence.
4 / 4
Keep exploring the corpus.
An OSRS market-analysis app whose research found predictive skill, losing trades, and a label bug that changed what four hours meant.
I built browser tools for comparing Old School RuneScape money-making methods and Grand Exchange margins, then tested whether price forecasts could support trading decisions. Historical studies reported predictive gains but losing trading strategies. An exact-horizon rebuild redirected the research toward risk context, and a later audit found feature and freshness defects that require revalidation before those gains can support the displayed rankings.
try it
The core analyzer and scanner use public OSRS Wiki prices without an account. On September 20, the optional research snapshot was still dated July 11, and account workflows remained unverified.
Technologies
- Python
- Pandas
- OSRS Wiki API
Skills
- Time-series ML
- Evaluation methodology
- Data pipelines
- Full-stack development
Links
- Historical research scope: 4,420 items, 627 money-making methods, and 1.55M observations; live catalog counts change
- Direction prediction: 57.43% accuracy vs 54.86% baseline (95% CI 56.76 to 58.14)
- Next-day volatility: 30.4% MAE improvement over rolling baseline
- Tax-hurdle selection: 0.727 ROC-AUC, 2.65x precision lift
- Tax math audit: 50,512 browser vs backend comparisons, zero mismatches
A useful forecast can still lose money
MMG began with a practical market question: which Old School RuneScape money-making methods and item flips are worth considering at current prices? The browser tools calculate margins and compare methods from public Grand Exchange data. The research asks a harder question, whether predicting future prices adds enough value to justify a trade.
The evaluated trading strategies lost money after costs, even where historical studies reported gains over prediction baselines. A label audit found that many returns called four-hour returns covered a different elapsed time. Repairing that target redirected the research toward risk context, but did not finish the validity work: a September source audit found future-dependent features and incorrect per-item freshness. The calculator remains independently useful, while model-driven rankings still need revalidation.
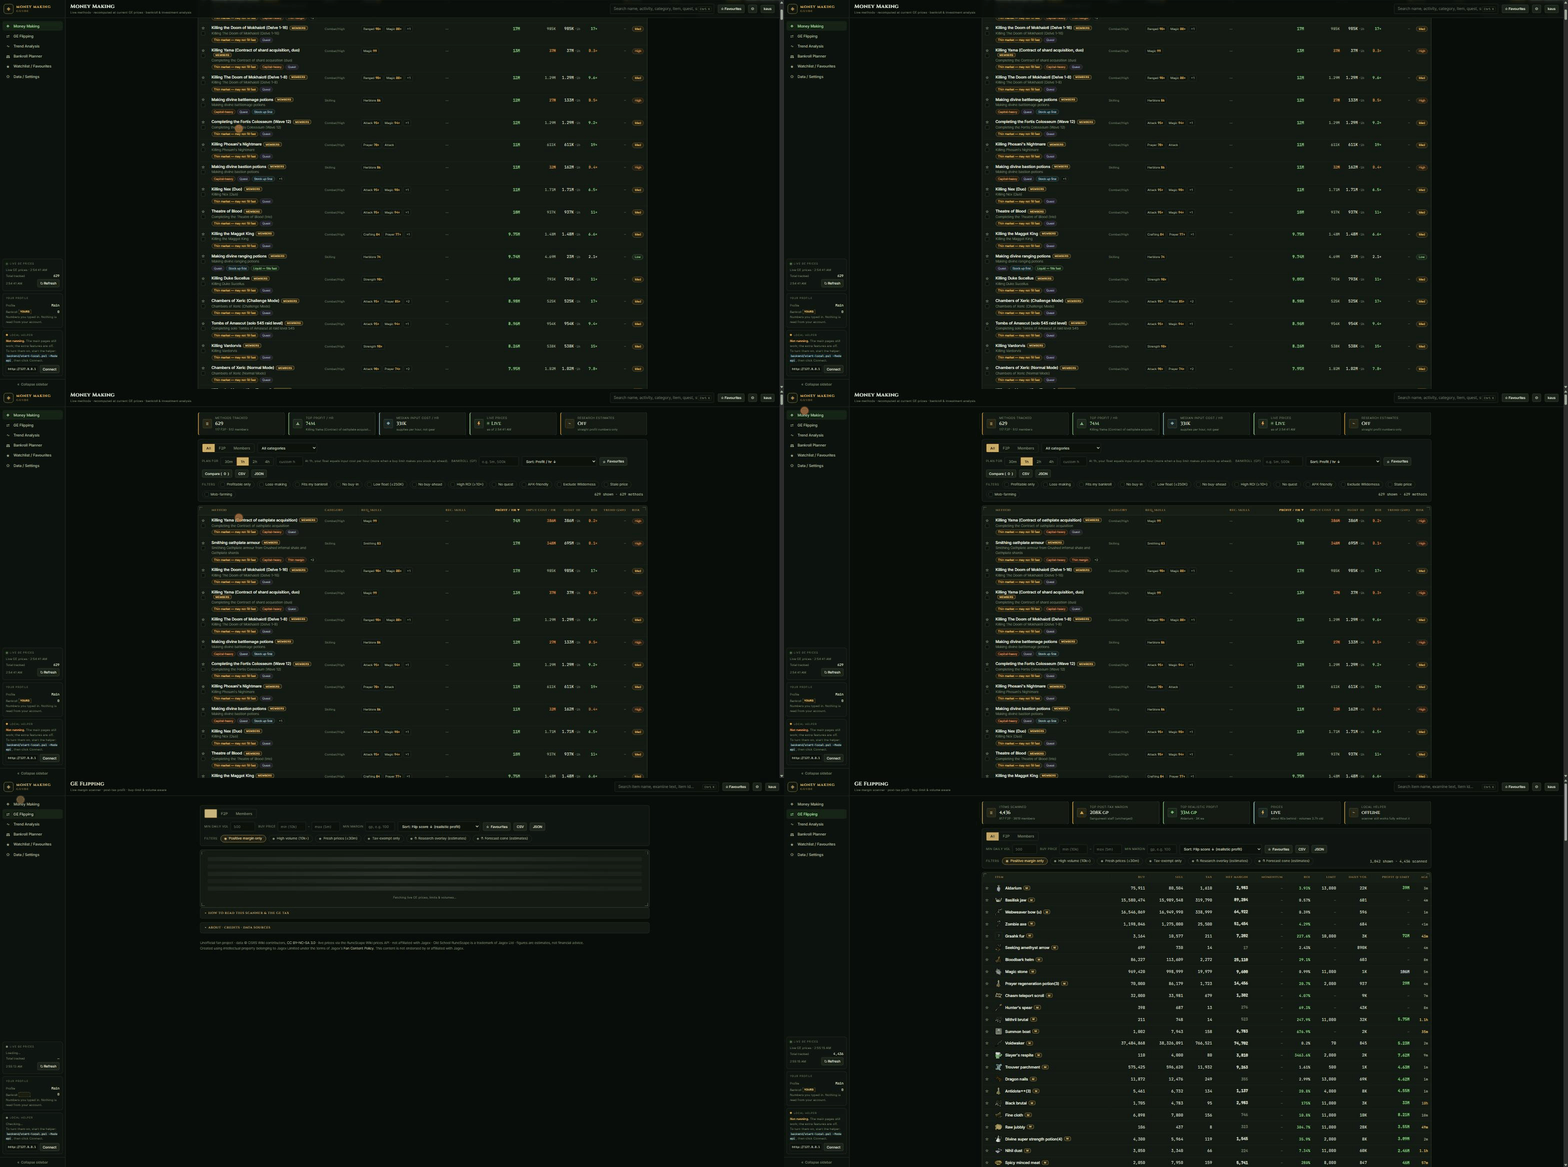
The price move has to pay for the trade
The Grand Exchange is a shared marketplace with changing prices, limited liquidity, and a tax on completed sales. In the research cost model, the sale tax is 2%, rounded down and capped at 5,000,000 gp per item. A profitable round trip must also cover the bid-ask spread and slippage. Predicting the direction of the midpoint is therefore only part of the decision.
This separates the calculator from the forecaster. The calculator applies known arithmetic to observed prices, while the forecaster estimates an uncertain future outcome. Even a well-calibrated probability of a rise cannot promise that an order fills at the displayed price or that the rise exceeds the full cost of execution. I kept those questions separate in both evaluation and the public interface.
A public calculator with optional services
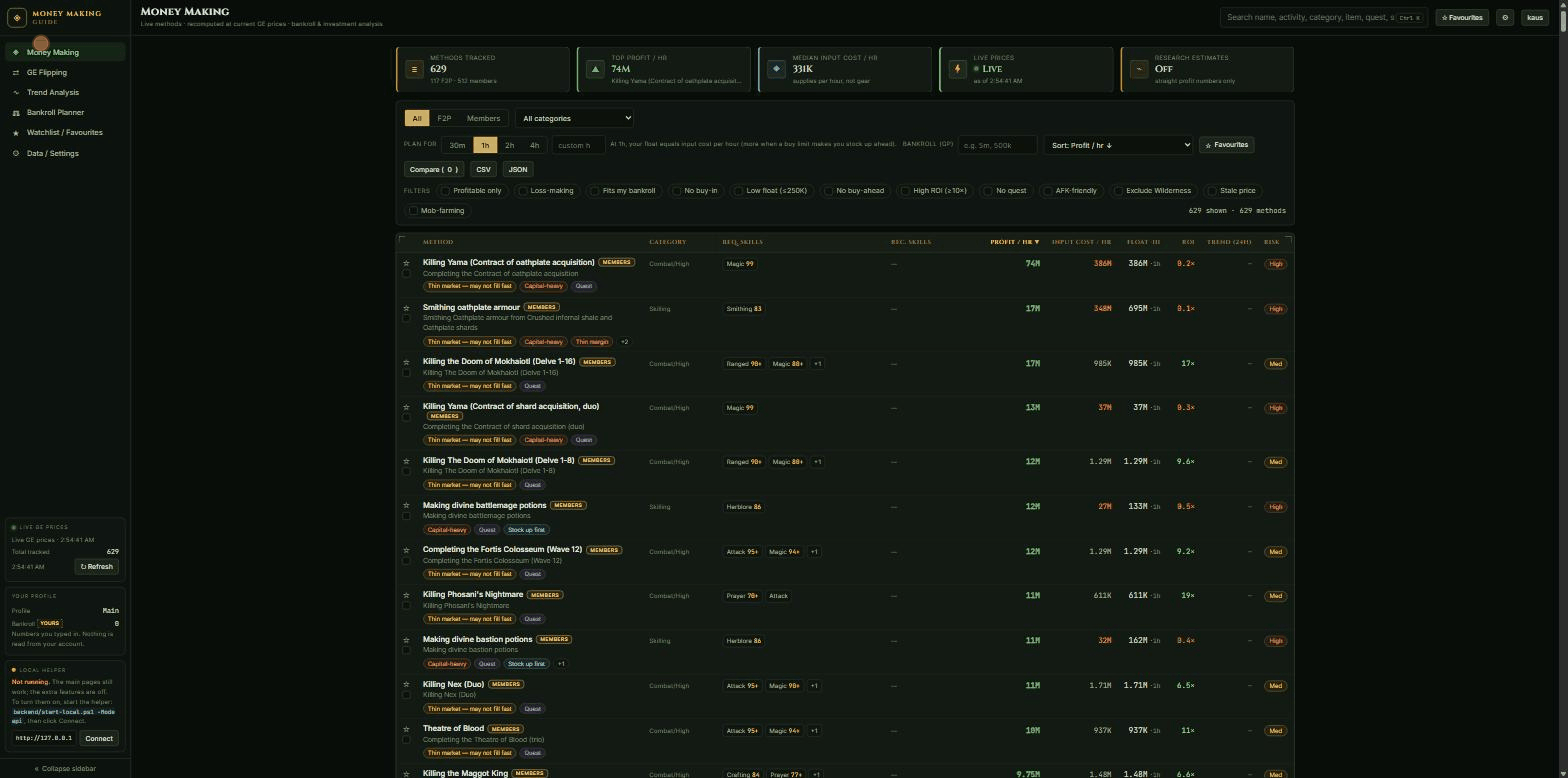
Five static pages cover money-making methods, GE flipping, trends, bankroll planning, and data/settings. The core calculations run in the visitor’s browser against public OSRS Wiki prices. That keeps the useful arithmetic independent of model serving or an account. An optional local-first FastAPI service adds collected history, a SQLite archive, feature and label builders, and research routes.
Selected research estimates and forecasts can load from published JSON snapshots without the local service. Method and GE history, planner profile sync, and Hiscores import have additional helper requirements. The frontend attempts loopback access when browser policy allows it and blocks remote plain-HTTP helpers from the HTTPS site. Browser policy, CORS, and reachability still determine whether that connection works.
A separate Postgres-backed accounts service implements registration, login, token refresh, browser-state sync, and subscription state. Live research routes have subscription checks, while static snapshots are ungated. Checkout remains a development test flow. This architecture gives the static product a usable core, but also creates separate questions about market freshness, snapshot age, helper availability, and account readiness.
architecture · mmg · topology verified from the September 17 repository checkpoint on September 18, 2026, not a live service-health check. The frontend also reads public Wiki prices directly, independently of the research pipeline.
Freeze the data before judging a model
The collector records five-minute, hourly, and daily price bars into SQLite. Keyed inserts avoid duplicate rows, and startup and hourly gap-repair attempts help recover missing history. The price archive is retained separately from operational audit records. These mechanisms support a growing history without proving continuous collection or complete recovery from every outage.
Completed days can be compacted into Zstandard Parquet through DuckDB, and research exports freeze an immutable dataset for each experiment. A run then reads the same data throughout its evaluation instead of a database changing underneath it. Invalid market observations are excluded rather than repaired with guessed prices.
The intraday features describe returns, spreads, trend, volume, cyclical time, price level, and liquidity. Direction models estimate the chance of a threshold rise, while quantile models estimate the range of possible returns. Calibration and residual-based widening make uncertainty part of the output. Walk-forward splits train on the past and test later periods, with an embargo at least as long as the prediction horizon.
The first edge did not clear the costs
The daily feasibility study used 1.55 million observations across 4,420 items from a public price snapshot. Direction accuracy reached 57.43% against a 54.86% majority-class baseline. The tax-hurdle classifier also found ranking signal, with 0.727 ROC-AUC and 45.7% precision among selected calls against a 17.2% base rate. Acting on those selections still lost 1,529,993 gp across 1,629 trades.
The original intraday study reported 74.0% direction accuracy against a 68.5% majority baseline and Brier skill of +0.19. A separate mechanical EMA crossover backtest on the intraday collection lost 75,099,719 gp across 47,203 trades. That rule was not a direct deployment of the classifier, so its loss does not by itself measure the classifier’s trading value. Alongside the daily proxy and later model-signal backtest, it showed why prediction metrics could not serve as the product’s trading acceptance gate.
The detailed experiments below retain the original setups and results. The intraday numbers also need the label correction that follows: their row-count horizon cannot be treated as an exact four-hour measurement.
Three figures from the ML research track, not the live margin analyzer. All three report the honest negative alongside anything that worked, matching the reports' own verdicts.
The phantom-spread debunk: what happens when you charge realistic fills
Same model signals, 30-day out-of-sample walk-forward, three different assumptions about which side of the spread a fill actually lands on. The net swings from a 22.9M gp "profit" to a 22.6M gp loss without changing the model at all, only the fill assumption. Two naive baselines (EMA crossover, random entry) are included for scale, under the same optimistic fills.
| Fill assumption (same model) | Trades | Net P&L | Win rate | Mean return / trade |
|---|---|---|---|---|
| Optimistic (buy avg_low / sell avg_high) | 29,696 | +22,905,763 gp | 67.1% | +24.71% |
| Mid-to-mid (pure direction, no spread) | 18,811 | -2,381,373 gp | 48.5% | n/a |
| Conservative (buy avg_high / sell avg_low) | 18,811 | -22,599,590 gp | 26.0% | n/a |
| Naive baseline (optimistic fills) | Net P&L | Win rate |
|---|---|---|
| EMA-cross | -61,714,074 gp | 21.4% |
| Random | -44,516,966 gp | 35.0% |
verdict, model_backtest.json
"SPREAD-CAPTURE ARTIFACT: model profit exists only under optimistic fills… NOT a validated trading edge."
results · mmg · backend/data/research/results/model_backtest.json
Historical comparison of two trading targets
The July study reported different results for buying at the ask and selling at the bid, versus assuming both passive offers fill. Changing the target changes its positive rate and the evaluation question. These historical estimates do not establish profitable fills or isolate a causal improvement in calibration.
| Target (base features) | AUC | AP (base rate) | Brier skill | Verdict |
|---|---|---|---|---|
| Taker net-positive (v2)buy the ask, dump the bid | 0.869 | 0.215 (2.2%) | -1.28 | high AUC, broken calibration |
| Market-maker net-positivepost bid at avg_low, ask at avg_high, minus tax | 0.844 | 0.698 (31.8%) | +0.24 | positive reported Brier skill |
On the historical market-maker target, the model had higher reported discrimination than ranking by current spread. This is a comparison of research scores:
| Market-maker net-positive | AUC | AP | AP lift |
|---|---|---|---|
| Model (LightGBM) | 0.844 | 0.698 | 2.20x |
| Spread-only heuristic (rank by spread_pct) | 0.712 | 0.474 | 1.49x |
The September audit found future-availability-dependent features and serving defects. Their effect on these scores is unmeasured. Revalidation is required after repairs. Read the audit summary.
results · mmg · reports/PHASE_A_RESULTS_2026-07-04.md
Model performance summary, daily-horizon research track
A separate research track on daily bars, same walk-forward, purge-and-embargo discipline as the intraday backtest above. Four sections: return regression against a persistence baseline, two classification targets, risk/spread forecasting against naive baselines, and a 3-regime walk-forward stability check.
Return regression, liquid-universe test set
| Model | MAE | Directional accuracy |
|---|---|---|
| Persistence (naive baseline) | 2.707% | 54.86% |
| Scaled SMA trend | 2.705% | 52.84% |
| Ridge | 2.711% | 50.25% |
| LightGBM Huber | 2.685% | 50.79% |
LightGBM Huber RMSE 4.873% vs. persistence RMSE 5.066%, a 0.81% MAE skill improvement over the naive baseline. Ridge and LightGBM both trail persistence on raw directional accuracy despite the MAE improvement, an honest mixed result, not a clean win.
Classification
| Target | Accuracy | Balanced acc. | ROC-AUC | Brier | Precision | Recall |
|---|---|---|---|---|---|---|
| Next-midpoint-up | 57.43% | 55.45% | 0.594 | 0.239 | 54.40% | 35.13% |
| Rise > 2.1% (tax hurdle) | 82.13% | 57.21% | 0.727 | n/a | 45.67% | 19.17% |
Risk and spread forecasting vs. naive baselines
| Task | Naive MAE | Model MAE | Improvement | Rank corr. |
|---|---|---|---|---|
| Absolute next-return (volatility) | 2.929% | 2.039% | 30.4% | 0.493 |
| Next spread | 2.051% | 1.924% | 6.2% | 0.582 |
Walk-forward, 3 regimes
| Regime | Direction AUC | Accuracy lift vs. majority baseline |
|---|---|---|
| Regime 1 | 0.576 | +2.51 pp |
| Regime 2 | 0.588 | +2.90 pp |
| Regime 3 | 0.594 | +2.57 pp |
The daily study reported AUC above 0.5 and positive accuracy lift in all three walk-forward regimes. These historical comparisons do not establish robustness outside those evaluations.
results · mmg · backend/data/research/results/daily_model_metrics.json
Four hours cannot be counted in rows
The original intraday label builder shifted a price series forward by 48 rows. With uninterrupted five-minute bars that spans four hours. With missing bars, it reaches further into the future. The model was being asked a variable-horizon question under a fixed-horizon name.
The continuity audit of the top 100 items scanned 839,687 rows and found 22,830 interior gaps. Of 834,887 row-shift labels, only 580,076 landed exactly 14,400 seconds later, a correct share of 69.48%. The repair joined targets by the exact timestamp offset and restarted rolling features at gaps. The resulting research dataset contains 802,443 rows across 789 items. That broader dataset and the continuity audit cover different item groups, so their row counts are not a before-and-after size comparison.
This changed how the earlier evidence could be read. A walk-forward split does not repair a mislabeled horizon, and the old and corrected model scores are not a controlled before-and-after comparison of algorithm quality. The rebuild establishes what each target means before asking whether a model predicts it.
A narrower direction, still needing validation
The historical reports motivated a shift toward risk and ranking, with distinct measurements. In the daily study, next-day volatility MAE improved by 30.4% over a rolling baseline, and next-day spread MAE improved by 6.2% over today’s spread, with 0.582 rank correlation. The corrected four-hour study reported 12.40% volatility MAE skill and 15.29% future-spread MAE skill against calibration-selected naive baselines. These belong to different horizons and datasets, and the later source audit means they remain exploratory evidence rather than validation of the displayed rankings.
The corrected study still did not validate trading recommendations. Only about 2.2% of its examples cleared the conservative tax, spread, and slippage hurdle, and its combined execution proxy remained negative. The product direction became risk context and margin-compression estimates, with trade signals parked until conservative, liquidity-aware backtests across multiple regimes and paper trading support them.
Abstention is part of that boundary. In one historical scoring run, 725 predictions narrowed to 18 candidate signals and all were suppressed by freshness checks. That successful check in the legacy scoring path does not validate the newer serving path, whose item-level freshness was later found to be wrong. A model confidence score cannot make an old observation current.
A working page is only one service boundary
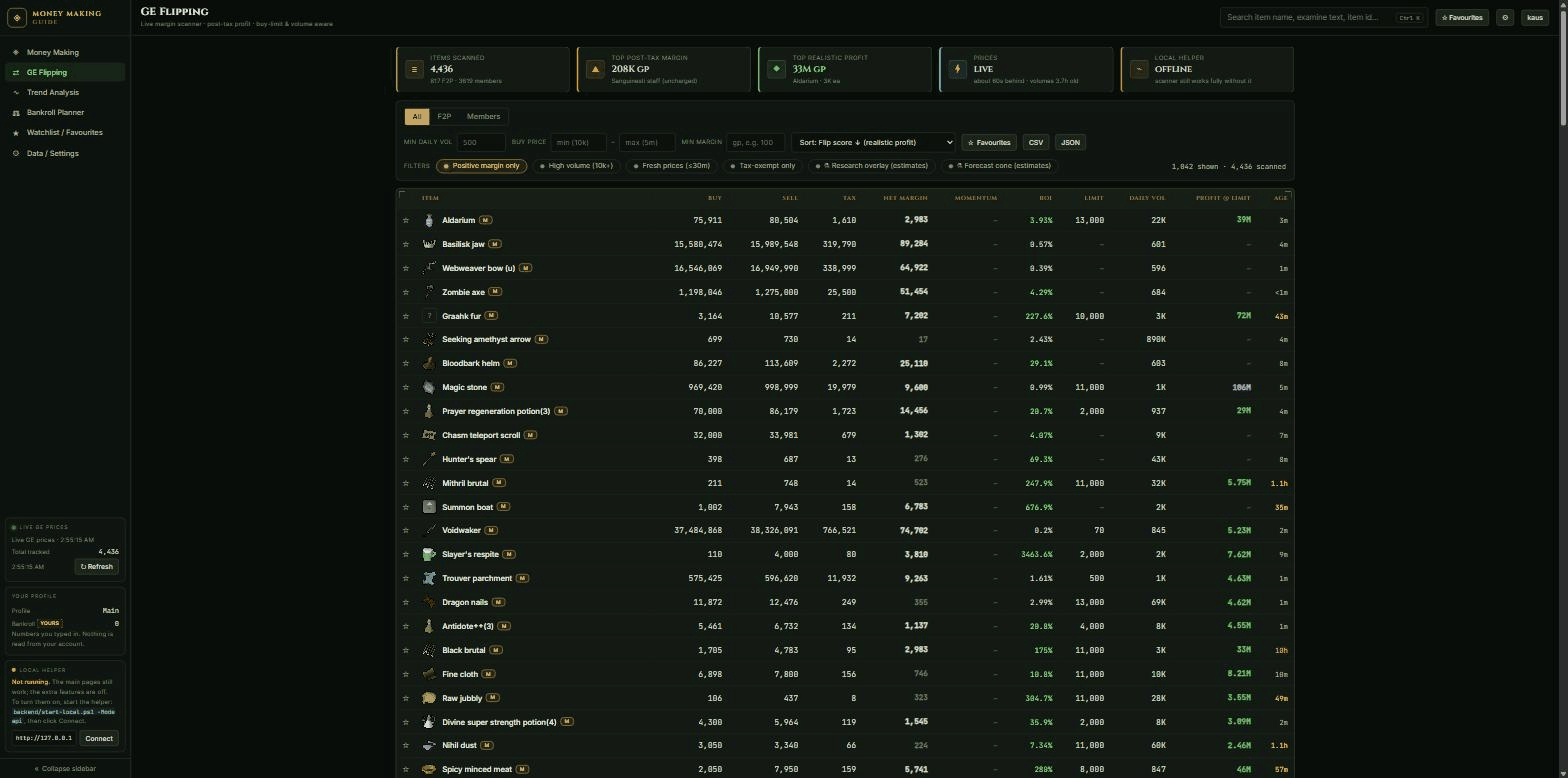
The September 18 check opened all five public pages, and the analyzer and scanner displayed live-price data. On September 20, the published research manifest was still dated July 11. The accounts health endpoint responded, but database readiness timed out. These observations describe different parts of the product, so a successful page load cannot stand in for fresh research or a functioning account.
The later browser check found a more specific mismatch. Celastrus bark showed current prices beside the research labels Low risk and upward margin, even though the record was marked gated and the published snapshot was roughly 72 days old. Its tooltip still reported an age of 140 hours. No expired forecast cone was observed against the current price chart, but stale risk and direction labels were visible.
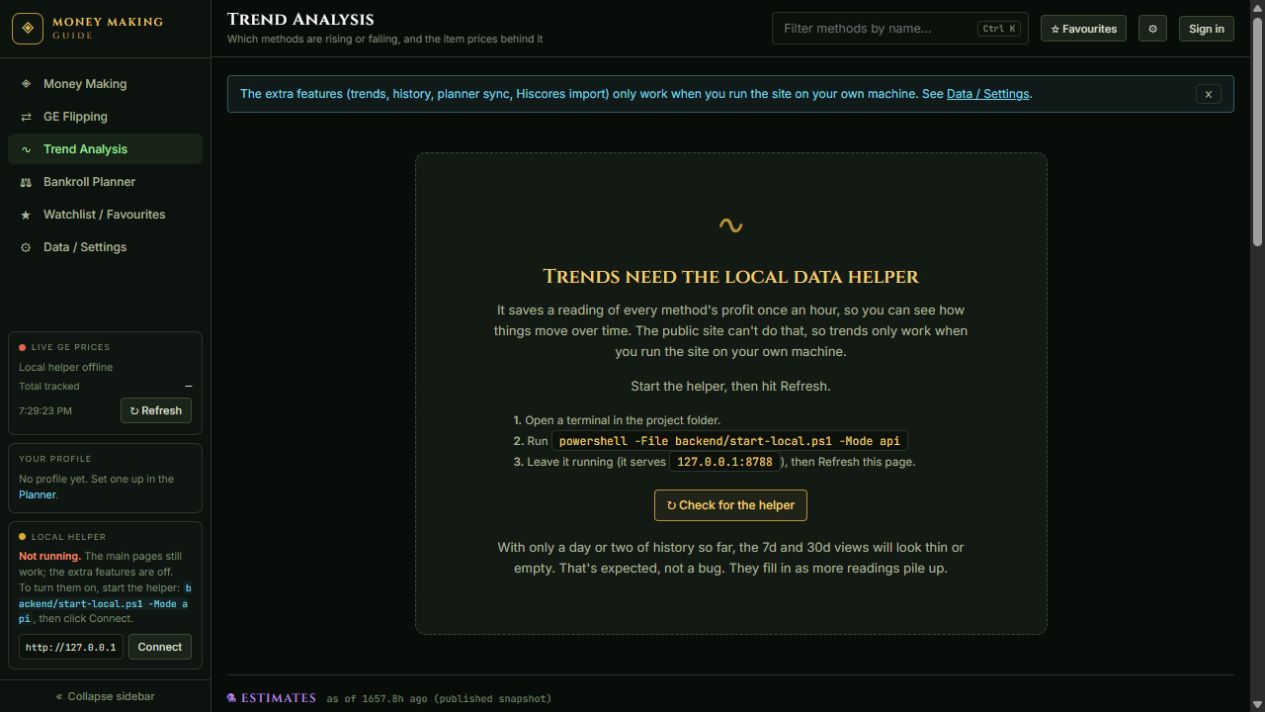
Tutorial dismissal worked in the September 20 check. Hosted login, session refresh, state sync, and planner editing remain unverified. The dated Trends capture below records the earlier helper-unavailable state and published-snapshot age.
The next audit went beyond the labels
The exact-horizon repair fixed the target, but future observations still affected the inputs. The builder joined future bars before calculating cross-item ranks. Removing one item’s future bar could therefore change another item’s present-time feature even when their observed histories stayed identical. An isolated before-and-after reproduction makes that dependency visible below.
The September 20 local repair builds current features and their comparison groups first. Training labels are attached afterward at the exact four-hour timestamp, while inference keeps a separate unlabelled artifact. Rolling features use the full available history before training rows are selected. Missing targets and unknown tax metadata remain unknown. Extreme future moves stay in the data with an explicit flag.
That changes the model’s input contract. The loader refuses historical weights and requires matching feature order, configuration, schema, and artifact hashes. Compatible datasets and models have not been rebuilt or trained. The synthetic checks establish specific software invariants, and the old performance scores cannot be carried forward to these new inputs. The exact displayed risk-adjusted ranking still needs its own evaluation.
Both versions receive the same present histories. Change only whether Item B has a future price bar in the dataset.
Item A’s future bar stays included in both measured cases.
Present-time feature percentile · B future bar removed
Before repair
Future bars decide the current cohort
- Item A
- 0.0
- Item B
- Excluded
Source a9b99f4
After local repair
Current features are built before labels
- Item A
- 1.0
- Item B
- 0.0
Source dd7b361
Item B’s training target is unknown. Its repaired current features stay the same in both cases.
The old builder lets a missing future target change what another item appears to know now. Separating inputs from labels removes that dependency in this fixture.
Feature percentiles only, not predicted rankings. This short synthetic history includes missing longer-window inputs and does not establish model readiness or improved historical scores. The repair is not deployed to MMG.
Measured before and after · isolated synthetic fixture · 2026-09-20
Feature: momentum_1h_rank
Download measured comparison (JSON)Give each estimate its own expiry
The serving boundary asks whether inputs are valid and whether they are still current. Each daily and intraday estimate has its own source interval, issue time, target, and expiry. Publishing an old snapshot again cannot renew it. Expired records lose their current rank, risk label, direction, and forecast, and cannot change the comparison group for a current item’s relative risk. Earlier browser fixtures showed estimates disappearing at expiry while historical prices and deterministic calculations stayed usable.
The new intraday loader is deliberately strict about missing inputs. If any requested item’s latest row is ineligible or nonfinite, the whole requested batch is unavailable. It does not substitute an older row or invent an imputation rule. Because observed receipt times are absent, availability still uses explicit interval-end and daily-date-end assumptions. Later metadata snapshots cannot fill earlier gaps. These rules sacrifice availability rather than silently treating an unknown input as known.
The component evaluator checks the training-data contract before fitting and requires a new output file, so it cannot silently replace a historical result. Completed outputs bind data, configuration, source, and dependency identities. Synthetic checks verified those safeguards with fitting intercepted.
A separate retained-record evaluator now reuses the ranking function used by serving. It selects the top candidates before reading their later outcomes, and compares spread ordering on the same eligible items. Missing outcomes do not trigger replacement selections. This tests the ordering within the eligibility rules, while leaving the value of those rules as a separate question. The synthetic example below shows why evaluating probability alone would miss the displayed decision.
These repairs remain local source checkpoints. The public MMG application has not received them. The downloadable records distinguish synthetic backend checks, earlier browser fixtures with mocked services, and dated public observations. Real-data rebuilding, compatible model training, real evaluation of the displayed ranking, and hosted acceptance remain separate work. Historical numerical results retain their unresolved bias, and no model-quality improvement is claimed.
Highest probability does not mean first place
The displayed score is p / (1 + 20 × volatility), where p is the model probability that the four-hour market-maker price proxy is positive after tax and assumed slippage. That proxy assumes both offers fill. In this hand-constructed fixture, item 2 has a 90% probability but receives a lower score than the two 80% rows because its predicted volatility is higher. This is a ranking rule, not an estimate of profit.
Probability and volatility are raw fixture inputs, including values withheld from gated display outputs. Volatility is the predicted absolute four-hour return, expressed as a fraction: 0.01 means 1%. Values are rounded for reading.
| Item | Input probability | Input volatility | Daily volume | Served score | Rank / decision |
|---|---|---|---|---|---|
| 1 | 80% | 0.01 | 5,000 | 0.667 | 1: Selected in top 2 |
| 3 | 80% | 0.01 | 5,000 | 0.667 | 2: Selected in top 2 |
| 2 | 90% | 0.04 | 5,000 | 0.500 | 3: Eligible, outside top 2 |
| 4 | 54% | 0.01 | 5,000 | 0.450 | Probability below 0.55 |
| 5 | 95% | 0.01 | 5,000 | Withheld | Forecast expired |
| 6 | 90% | 0.01 | 4,999 | Withheld | Daily volume below 5,000 |
Probability must be at least 0.55, daily volume at least 5,000, and the forecast current and otherwise valid. Nonfinite numeric predictions are rejected. Equal scores use ascending item ID, so item 1 precedes item 3. Item 4 retains a score of 0.450 but falls below the probability threshold: a score alone does not confer rank eligibility. Expiry and liquidity gates withhold scores for items 5 and 6. The eligible order is 1, 3, 2; selecting the first two happens before looking up their later outcomes. A missing outcome does not allow a lower-ranked item to take its place.
A spread-only ordering selects items 2 and 3 from that same eligible group. This comparison can test ordering within the gates; it cannot establish whether the gates themselves are useful. Real evaluation of either ordering is still absent.
Experiments
3 experiment write-ups · continued development log
Daily-horizon feasibility study · 2026-07 · completed
Setup
Built a daily-bar research dataset from a public Kaggle snapshot of GE prices (CC BY 4.0, 1.55 million observations across 4,420 items, 2021-2026), cross-checked against 50 items from Weird Gloop's independent historical archive (60.2% daily-direction agreement, under 1% median price difference between the two sources). Trained a small family of models, a persistence baseline, a smoothed-trend model, ridge regression, gradient-boosted trees, a direction classifier, and a tax-hurdle classifier, on time-based splits with a purge-and-embargo gap between train and test windows. Separately audited the tax and fee math itself: 50,512 browser-versus-backend tax comparisons across every mapped item and boundary price, zero mismatches.
Result
Direction accuracy reached 57.43% against a 54.86% majority-class baseline, a 2.51-2.90 percentage point edge that held across all three walk-forward regimes tested, not one favorable split. The tax-hurdle classifier, trained to flag next-daily-midpoint rises above 2.1% as an approximate tax threshold, reached a 0.727 ROC-AUC and 45.7% precision on its selected calls against a 17.2% base rate, a reported 2.65x lift. The separate tax-aware holding proxy still lost 1,529,993 gp across 1,629 selected trades, a 33.7% win rate and a -3.06% mean trade ROI, and a separate uncertainty-abstention rule that let through only its single most confident trade also lost money on that one trade.
What it changed
The report ruled out a profitability claim, automation, or a live "buy now" badge from this model. That verdict set the template the rest of the project followed: prioritize the historical risk-oriented results for further validation, keep anything resembling a trade recommendation out of the product, and test the same question again on faster, higher-resolution data before drawing a final conclusion.
Label-integrity audit and exact-horizon v2 rebuild · 2026-07 · completed
previously
The daily-bar study reported a small directional accuracy improvement (57.43% vs. a 54.86% baseline) and improvements on risk-forecasting metrics, but its own tax-aware backtest lost 1.53M gp across 1,629 trades, so no daily trade signal shipped. The natural follow-up was to test the same question on faster, higher-resolution 5-minute data, using the same horizon-48 convention (48 five-minute bars, meant to represent 4 hours ahead) the intraday pipeline already used to build training labels.
Setup
An audit ran against the top 100 items by volume to check what "four hours" actually meant inside the label-building code, since a label was built by shifting each row 48 places forward and calling that "4 hours later" without checking whether 48 five-minute bars had actually elapsed. 839,687 rows were scanned for interior gaps in the 5-minute series.
Result
22,830 interior gaps turned up in that scan. Of the 834,887 labels built by the 48-row shift, only 580,076 were actually 14,400 seconds (4 real hours) apart, 69.48%. The other roughly 30% were built across some other span entirely, usually longer, because a gap in the data meant the 48th row forward was more than 4 hours away. The audit's own summary of the problem: counting 48 buses does not measure four hours if some buses never came.
What it changed
The label builder was rebuilt to join every label at the exact wall-clock offset (bucket_ts + 14,400 seconds) instead of a row count, and to restart its rolling-feature windows at every gap rather than let them silently span one. The corrected "v2" dataset contains 802,443 exact-horizon rows across 789 items and 8,669 distinct market buckets (the same 2026-06-04 to 2026-07-04 window), with a 22.88% base rate for a 1%+ price rise and a 2.19% base rate for a trade still positive after tax, spread, and slippage. The continuity audit covered the top 100 items and this rebuilt dataset covers 789, so those row counts are not a before-and-after comparison. Exact horizons repair the target timing, but a September source audit found future-dependent feature construction. Its effect on these historical metrics remains unmeasured, and they require revalidation.
Intraday direction classifier and tax-hurdle backtest · 2026-07 · completed
previously
The exact-horizon audit found that the original intraday label-building convention, shifting 48 rows forward and calling it "4 hours," was only actually a 4-hour gap 69.48% of the time once real data gaps were accounted for. The rebuilt v2 dataset (802,443 rows, 789 items) joins every label at the true wall-clock offset instead. The direction classifier and backtest below were run on the original 30-day intraday collection using the same horizon-48 convention the audit flagged, worth keeping in mind when reading the accuracy number; the risk-model results that follow were measured on the exact-horizon v2 data. A later source audit found future-dependent features and serving defects, so these remain historical exploratory measurements pending revalidation.
Setup
A 30-day backfill collected 12,989,122 real five-minute price bars (2026-06-04 to 2026-07-04) across roughly 1,200 liquid items (daily volume at least 5,000), costing about 8,450 API requests over roughly 2.9 hours at the collector's rate limit. A LightGBM direction classifier was trained on about 5.5 million labelled rows with 4-fold walk-forward validation and an embargo at least as long as the prediction horizon, to estimate the probability that an item's midpoint return would be at least 1% over the next 4 hours.
Result
The classifier reached 74.0% direction accuracy against a 68.5% base rate (always predicting no rise of at least 1%), a +5.5 percentage point edge, with a Brier skill of +0.19, a positive historical result against the constant-probability baseline. A separate mechanical 12/48-bar EMA crossover rule, rather than a direct deployment of that classifier, taxed at 2% with 5 basis points of slippage and volume-capped fills, lost 75,099,719 gp across 47,203 trades: a 21.2% win rate, a profit factor of 0.14, and a -5.1% mean return per trade. Live-scoring the trained model separately produced 725 predictions, narrowed to 18 candidate signals, all 18 of which were suppressed by the staleness gate before reaching a UI, a successful check in that legacy scoring path, separate from the newer item-freshness defect found in September.
What it changed
Three evaluated approaches had negative aggregate backtests: the daily proxy, this mechanical intraday rule, and a later backtest of the model's own trading signals under realistic fill assumptions (see the results figures below). That result is what the project's planning doc formally calls the direction realignment: park the trade-signal stack, keep the champion and drift-monitoring plumbing wired up but silent, and prioritize volatility and spread forecasting for further research. The September source audit requires point-in-time feature and serving repairs before those risk and ranking features can be revalidated. The project's own framing of the underlying reason: in a taxed market a forecast has to be correct by more than the toll, not just correct.
notes
- Unofficial fan tooling, not affiliated with or endorsed by Jagex. Old School RuneScape is a trademark of Jagex Ltd.
- Price data sourced from the community-run OSRS Wiki real-time prices API, with attribution. Figures can be stale or incomplete.
- Analysis and research only. No trading automation is exposed, and ML output is research-only, never a trade signal.